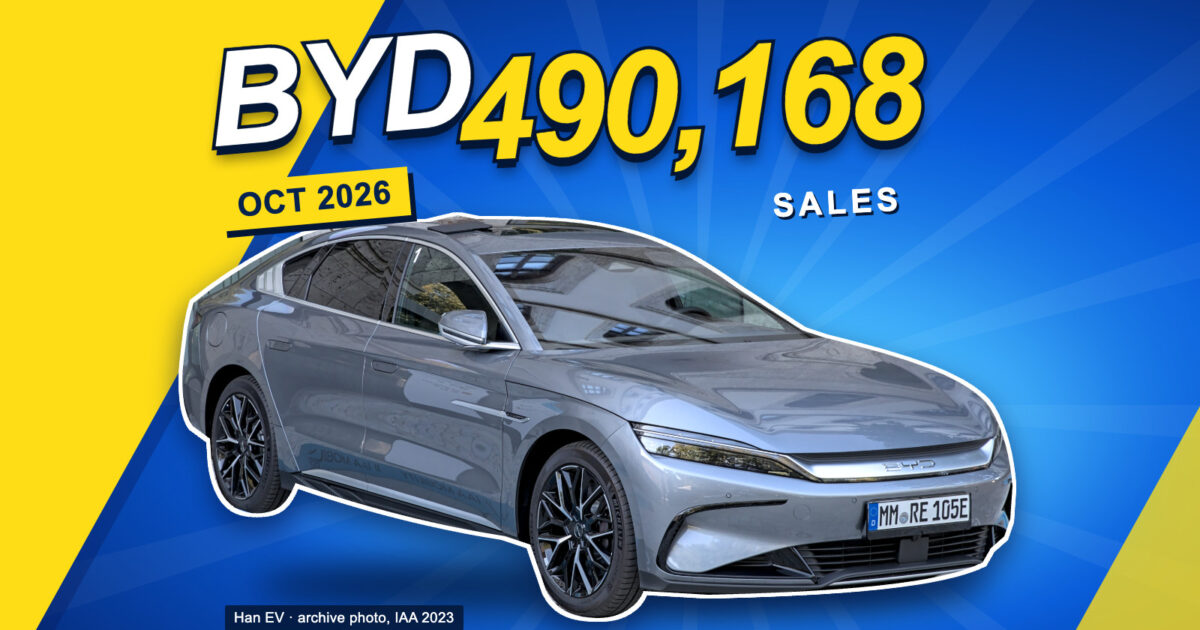
BYD October 2026 sales reached 490,168 new-energy vehicles, up 10.97% year on year and 5.74% from September. Battery EVs accounted for 63.3% of passenger-vehicle sales. Exports more than doubled from October 2025, but declined from September 2026. In the third quarter, BYD also became the top-selling Chinese brand above the 200,000-yuan mark, with 173,507 retail units. The monthly gain still came against a weaker year-to-date total: January–October sales remained down 2.16%.
BYD released its October headline figures on November 1, followed by its stock-exchange production and sales filing on November 2. The most useful reading is a change in sales mix and the distinction between annual export growth and the latest monthly movement.
Data checked November 6, 2026. Premium-brand growth rates, the Q3 200,000-yuan-plus ranking and Q3 financial figures were added on November 6. Figures below are company-reported vehicle sales, not customer registrations. BYD says the monthly filing is unaudited and may be adjusted. Percentage changes identified as calculations are BYDToday calculations from the linked filings.
BYD October 2026 sales at a glance
Passenger vehicles contributed 483,125 of BYD’s 490,168 October sales; commercial vehicles added 7,043. The battery-electric and plug-in hybrid figures below are subdivisions of passenger vehicles, so they should not be added again to the group total.
On a small screen, swipe the table horizontally to see all columns.
| Measure | Oct 2026 | Sep 2026 | Oct 2025 | Oct YoY |
|---|---|---|---|---|
| Total new-energy vehicles | 490,168 | 463,561 | 441,706 | +10.97% |
| Passenger vehicles | 483,125 | 456,713 | 436,856 | +10.59% |
| Battery-electric passenger vehicles | 305,743 | 273,143 | 222,559 | +37.38% |
| Plug-in hybrid passenger vehicles | 177,382 | 183,570 | 214,297 | −17.23% |
| Commercial vehicles | 7,043 | 6,848 | 4,850 | +45.22% |
| NEV exports (filing) | 170,194 | 180,700 | 83,904 | +102.84% |
Sources: BYD October 2026, September 2026 and October 2025 filings. Monthly year-on-year changes are calculated from the vehicle counts; they differ from the year-to-date growth column in the October filing.
Exports doubled annually, but fell from September
BYD’s filing reports 170,194 NEV exports in October, up 102.84% from 83,904 a year earlier. Exports represented 34.7% of October’s total group sales, calculated using the same filing’s total of 490,168 vehicles.
The monthly comparison tells a different story. Exports fell by 10,506 vehicles, or 5.81%, from September’s 180,700. Total sales nevertheless rose by 26,607 vehicles. Subtracting exports from total sales gives a non-export remainder of 319,974 in October versus 282,861 in September, an increase of 37,113, or 13.12%.
That arithmetic shows why October’s month-on-month increase cannot be described as export-led. The remainder is a calculation from company totals; it is not a measure of Chinese retail registrations or a basis for estimating China market share.
Why the release also shows 169,564 overseas sales
BYD’s November 1 sales release separately reports 169,564 overseas passenger-vehicle and pickup sales, up 103% year on year as rounded by the company. Its cumulative figure for that measure is 1,507,395 for January–October.
The stock-exchange export figure and this overseas sales figure have different labels and scopes. The releases do not reconcile the 630-vehicle difference. They should stay separate rather than being used interchangeably. Neither release provides a country-by-country October retail breakdown, shipping-capacity utilization or evidence that logistics, rather than demand, was the limiting factor.
The company release adds two markers of the overseas build-out: the Camaçari plant in Brazil produced its 100,000th vehicle in late October, and BYD says its passenger and pickup business now covers more than 120 countries and markets. For the longer-term factory and market context, see BYD’s global expansion: sales, factories and market strategy.
Battery EVs reached 63.3% of passenger sales
BYD sold 305,743 battery-electric passenger vehicles and 177,382 plug-in hybrid passenger vehicles in October. Battery EV sales rose 11.94% from September and 37.38% year on year. Plug-in hybrids fell 3.37% month on month and 17.23% year on year.
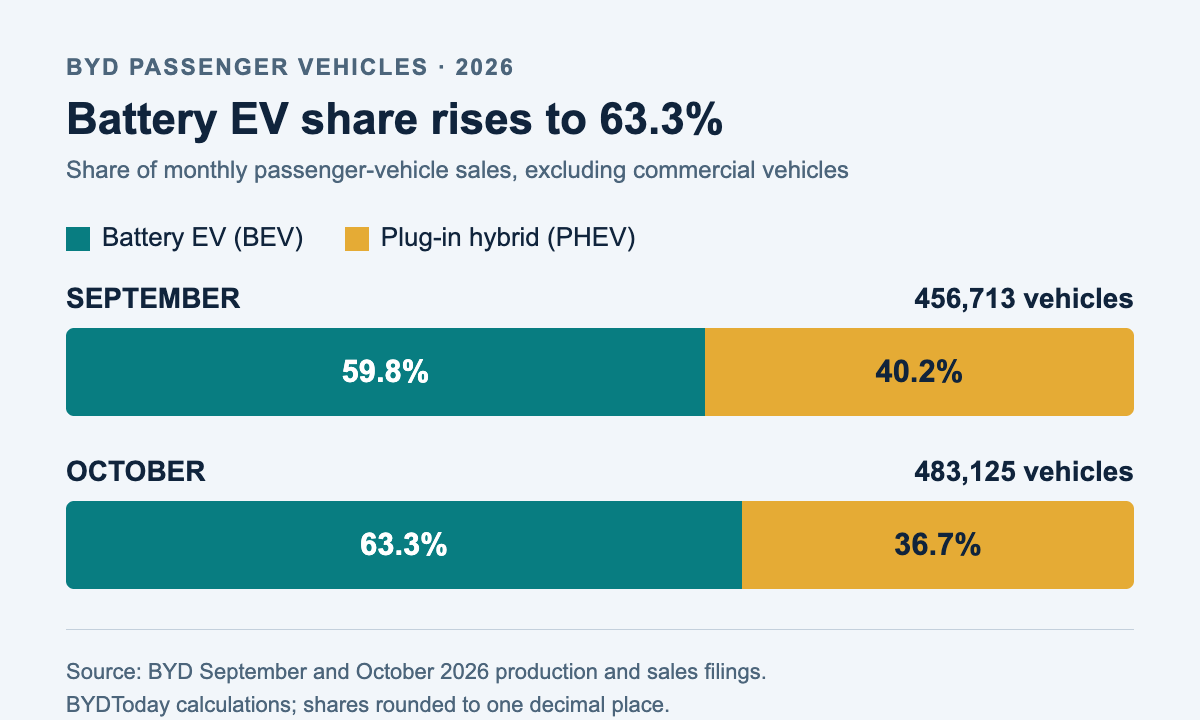
The BEV share increased from 59.8% to 63.3%, a rise of about 3.5 percentage points. The filings establish the shift in volume. They do not quantify how much came from charging technology, battery changes, prices, individual launches or export-market demand. Attributing the increase to one technology would require model-level sales and matching market evidence.
Dynasty and Ocean supplied most of the passenger total
BYD’s company release divides October passenger sales into the following brands and sales networks. Dynasty and Ocean are grouped together by BYD; the release does not provide a separate total for each.
On a small screen, swipe the table horizontally.
| Brand or network | Sales | Share of passenger total |
|---|---|---|
| Dynasty and Ocean | 423,843 | 87.7% |
| Fangchengbao | 43,872 | 9.1% |
| Denza | 15,152 | 3.1% |
| Yangwang | 258 | 0.1% |
| Passenger total | 483,125 | 100.0% |
Source: BYD’s October sales release and accompanying poster. Shares are BYDToday calculations, rounded to one decimal place.
Fangchengbao was the largest contributor outside Dynasty and Ocean, with 43,872 vehicles, up 41.3% year on year, and it was the top-selling Chinese “new force” brand with an average transaction price above 200,000 yuan. Denza delivered 15,152, up 49.5% year on year, with a company-reported transaction price of about 330,000 yuan. Yangwang added 258 units as the technology flagship. Together the three premium brands accounted for roughly 59,300 October sales, or 12.3% of the passenger total.
The premium shift is larger than one month. Across January–September, Fangchengbao, Denza and Yangwang grew a combined 75.1% year on year and supplied 13.3% of BYD’s passenger-vehicle sales. Within Fangchengbao’s October figure, AutoDaily reported that the Ti 7 alone exceeded 30,000 units — a media-reported model-level figure that BYD’s release does not confirm at that granularity.
These counts still describe volume, not profitability. The monthly sources do not establish a profit contribution for Yangwang or a model-by-model ranking against other manufacturers, but the third-quarter retail ranking in the next section does establish one premium-market benchmark.
The 200,000-yuan-plus market: BYD now leads Chinese brands
Beyond the brand split, the quarter-level data shows where that premium volume lands. BYD’s retail sales of vehicles priced above 200,000 yuan reached 173,507 units in the third quarter — the highest of any Chinese brand, and the only Chinese brand above 150,000 units for the quarter, according to third-quarter retail data reported by Chinese media citing industry retail statistics.
On a small screen, swipe the table horizontally.
| Brand group | Q3 retail units | Source |
|---|---|---|
| BYD (20万+ models) | 173,507 | Company release, media-reported retail ranking |
| Tesla (China) | 142,133 | Third-quarter retail ranking (Tencent News report) |
| HarmonyOS Intelligent Mobility (AITO and partners) | 119,833 | Third-quarter retail ranking (Tencent News report) |
| Xiaomi EV | 101,435 | Third-quarter retail ranking (Tencent News report) |
The monthly progression also moved upward rather than spiking once: roughly 50,529 in July, 52,389 in August and 65,895 in September on the same retail basis, with October described as a further record. The ranking covers retail units in China, not revenue or profit, and the comparison groups differ in size and price mix — Tesla’s figure spans its whole China lineup, while BYD’s counts only models above the 200,000-yuan line.
A stronger October still leaves the year-to-date total lower
January–October group sales reached 3,621,744 vehicles, down 2.16% from 3,701,852 in the same period of 2025. Within passenger vehicles, year-to-date BEV sales rose 5.86% to 1,935,700, while PHEV sales fell 11.02% to 1,625,969.
October’s recovery therefore narrows the annual gap without erasing it. November and December figures will show whether the higher BEV mix persists and whether exports return above September’s level. The October releases alone do not establish a full-year result, a Chinese retail market-share record or a financial earnings outcome.
The financial picture behind the premium shift is genuinely mixed. BYD’s third-quarter report shows revenue of 221.49 billion yuan for Q3, up 13.59% year on year, with attributable net profit of 10.02 billion yuan, up 28.08% — a single-quarter high despite price competition. But the nine-month attributable net profit of 22.35 billion yuan is still down 4.24% from a year earlier, dragged by foreign-exchange losses and lower investment income. Higher volumes above 200,000 yuan have not yet translated into nine-month profit growth, and research spending of 36.3 billion yuan for the first three quarters still exceeds the period’s net profit.
Frequently asked questions
How many vehicles did BYD sell in October 2026?
BYD reported 490,168 new-energy vehicles sold in October 2026, including 483,125 passenger vehicles and 7,043 commercial vehicles. Total sales rose 10.97% year on year and 5.74% from September.
How many battery EVs and plug-in hybrids did BYD sell?
BYD sold 305,743 battery-electric passenger vehicles and 177,382 plug-in hybrid passenger vehicles in October 2026. Battery EVs represented 63.3% of passenger-vehicle sales, up from 59.8% in September.
How many vehicles did BYD export in October 2026?
The October stock-exchange filing reports 170,194 new-energy vehicle exports. That is 102.84% above the 83,904 exported in October 2025, but 5.81% below September 2026 exports of 180,700.
Why are BYD exports and overseas sales different numbers?
BYD reported 170,194 new-energy vehicle exports in its October filing and 169,564 overseas passenger-vehicle and pickup sales in its company release. They are differently labelled measures. The releases do not provide a reconciliation of the 630-vehicle difference.
Were BYD year-to-date sales also growing?
No. BYD reported 3,621,744 new-energy vehicle sales in January–October 2026, down 2.16% from 3,701,852 a year earlier, despite the increase in October sales.
Is BYD the best-selling Chinese brand above 200,000 yuan?
On a retail basis for the third quarter of 2026, yes: 173,507 units above the 200,000-yuan line made BYD the top-selling Chinese brand in that price band, ahead of Tesla China at 142,133, per media-reported industry retail statistics. The claim covers China retail volume for one quarter, not annual global sales or revenue.
Do these figures show BYD’s share of China’s retail car market?
No. BYD’s company-reported sales and export figures do not establish its share of China’s retail passenger-car market. A market-share calculation needs a matching retail numerator, denominator and reporting period.
Sources, method and image credits
By BYDToday Editorial. This report uses BYD’s company release and regulatory filings. Comparisons use the same reported category and period wherever available. Percentages may differ slightly from company headlines because of rounding.
- BYD: October sales exceed 490,000 vehicles, November 1, 2026. Headline sales, overseas passenger vehicles and pickups, and brand/network totals.
- BYD October 2026 production and sales announcement, November 2, 2026, announcement 2026-047. Group, passenger, powertrain, commercial, export and year-to-date figures.
- BYD September 2026 production and sales announcement, filed October 8, 2026. Month-on-month comparison figures.
- BYD October 2025 production and sales announcement, November 2, 2025. Prior-year export comparison.
- CNR (China National Radio): BYD October sales exceed 490,000, November 6, 2026. Premium-brand growth rates, Q3 200,000-yuan-plus total of 173,507 units, Camaçari 100,000th vehicle and 120+ market coverage.
- Tencent News: BYD leads the Chinese-brand ranking above 200,000 yuan, November 2, 2026. Q3 retail comparison figures for Tesla China, HarmonyOS Intelligent Mobility and Xiaomi EV, plus monthly progression.
- China Securities Journal: BYD Q3 2026 report, October 30, 2026. Q3 and nine-month revenue, attributable net profit and research spending.
Cover: BYD Han EV photographed at IAA Mobility on September 5, 2023, by Alexander-93 (Alexander Migl), via Wikimedia Commons, CC BY-SA 4.0. BYDToday added the layout and October 2026 sales text; the cover adaptation is shared under the same licence. The photograph is archive context, not a 2026 model or October event photograph. Inline chart: BYDToday, based on the linked BYD filings.