Quick Answer: China exported 2.615 million new energy vehicles in 2025 and 2.355 million in the first half of 2026 under CAAM’s manufacturer-reporting baseline. Those totals cover battery-electric, plug-in-hybrid and fuel-cell vehicles, but they are not the same as customs declarations, passenger-only tables or automakers’ overseas sales. This tracker labels the source, period and vehicle scope before comparing any number.
Last verified: July 17, 2026. The latest complete period in the CAAM series is January–June 2026; the latest standalone month is June 2026. First-half results are not annualized.
Page role: This is BYDToday’s permanent owner for China NEV export history, current data, destinations, brands, trade barriers and overseas localization. Dated monthly stories remain supporting pages and should point here for definitions.
The number depends on the definition
“China EV exports” sounds like one statistic, but at least four legitimate datasets sit behind the phrase. CAAM reports automakers’ export shipments. China Customs records goods crossing the border under commodity codes. The China Passenger Car Association publishes a narrower passenger-car view that is especially useful for destination and manufacturer tables. Automakers then disclose “overseas sales,” which may include cars produced outside China.
The figures can all be accurate and still differ. The error is presenting them as interchangeable—or subtracting one series from another to invent a missing category.
| Label | What it measures | Useful for | Do not assume |
|---|---|---|---|
| CAAM exports | Manufacturer-reported wholesale/export shipments across the auto industry. | A consistent national history and current BEV/PHEV split. | That every unit has the same customs declaration date or commodity code. |
| Customs / NBS trade | Border declarations classified by customs codes; the 2025 statistical communiqué specifies automobiles including chassis. | Physical trade, value and commodity analysis. | That its total should equal CAAM or passenger-car reports. |
| CPCA passenger exports | Passenger-vehicle manufacturer data; some tables distinguish whole vehicles and CKD kits. | Destinations, passenger-car brands and monthly market structure. | That commercial vehicles or all CAAM categories are included. |
| Company overseas sales | A company-defined measure that may be wholesale, retail or deliveries outside China. | Assessing an automaker’s international business. | That every vehicle was built in or exported from China. |
Vehicle identity also needs a label. China-origin describes where the car was made, so Tesla vehicles produced in Shanghai can appear in origin-based export data. Chinese brand describes ownership or branding, not the factory location. A BYD built in Thailand can raise BYD’s overseas sales without raising China’s exports.
China NEV export history: one consistent CAAM baseline
CAAM’s series shows the structural change clearly. China crossed two million total vehicle exports in 2021, passed three million in 2022 and reached 4.91 million in 2023, when it became the world’s largest vehicle exporter by annual volume. NEVs grew much faster than the total through 2023, paused in 2024 as BEV exports declined, then accelerated sharply in 2025 and early 2026 as plug-in hybrids became a larger part of the mix.
| Period | All vehicle exports | NEV exports | BEV / PHEV detail | Interpretation |
|---|---|---|---|---|
| 2021 | 2.015 million | 310,000 | Not stated in the cited release | First year above two million total exports. |
| 2022 | 3.111 million | 679,000 | Not stated in the cited release | NEV exports more than doubled year on year. |
| 2023 | 4.910 million | 1.203 million | Not stated in the cited release | China moved to first place in annual total vehicle exports. |
| 2024 | 5.859 million | 1.284 million | 987,000 BEV; 297,000 PHEV | BEVs fell 10.4%; PHEVs rose 190%. |
| 2025 | 7.098 million | 2.615 million | 1.646 million BEV; 969,000 PHEV | NEV exports rose 103.7%; PHEV growth was fastest. |
| Jan–Jun 2026 | 5.096 million | 2.355 million | 1.433 million BEV; 922,000 PHEV | Partial year only; do not compare directly with a full year. |
Why the old 2024 figure was wrong: the source DOCX said China exported about 1.82 million NEVs in 2024. CAAM’s published total is 1.284 million. The owner uses 1.284 million and retains the reported BEV/PHEV split so the error cannot propagate.
2026 China NEV export tracker
For a running tracker, cumulative checkpoints are safer than back-calculating monthly volumes. Each row below is a result published for that period. June is shown separately because CAAM explicitly reported the standalone month. The differences between cumulative rows should not be presented as official monthly data without checking revisions and rounding.
| Reported period | NEV exports | Type | How to read it |
|---|---|---|---|
| January | 302,000 | Standalone month | Beginning of the 2026 CAAM series. |
| January–February | 583,000 | Cumulative | Do not label this as February volume. |
| January–March | 954,000 | Cumulative | First-quarter checkpoint. |
| January–April | 1.384 million | Cumulative | Four-month checkpoint. |
| January–May | 1.833 million | Cumulative | Five-month checkpoint. |
| January–June | 2.355 million | Cumulative | Latest complete period; up about 120% year on year. |
| June | 523,000 | Standalone month | Up 160% year on year; included in the H1 total. |
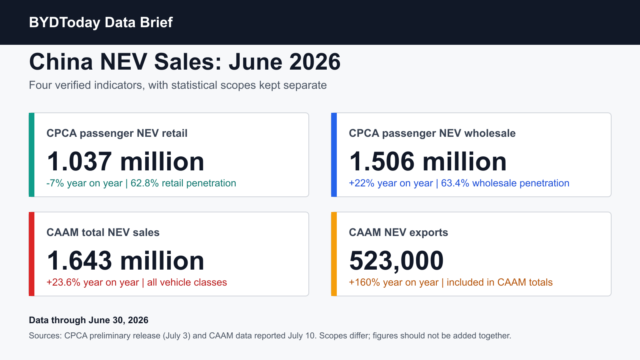
June illustrates why source labels matter. CAAM reported 523,000 NEV exports across its industry series. CPCA reported 499,000 new-energy passenger-car exports. Neither is necessarily wrong: the vehicle scope and reporting system differ.
Why customs and CAAM totals do not match
China’s 2025 National Economic and Social Development Statistical Communiqué reported 8.32 million automobiles including chassis exported through customs, up 30%, with a value of RMB 1.0183 trillion. CAAM reported 7.098 million vehicle exports from manufacturers. A CPCA/customs-derived market table put 2025 NEV exports at about 3.43 million, while CAAM’s NEV series was 2.615 million.
Those gaps can reflect declaration timing, commodity-code coverage, finished vehicles versus chassis or CKD material, passenger-only versus all-vehicle scope, revisions and the point in the distribution chain where the shipment is recorded. The correct response is not to choose whichever number is larger. It is to name the source and use it consistently for the question being answered.
- Use CAAM for the historical owner series and BEV/PHEV trend.
- Use Customs for border-trade quantity, value and commodity-code analysis.
- Use CPCA for passenger-car destinations and manufacturer snapshots.
- Use company disclosures for business performance, while checking whether local production is included.
Where China-made NEVs went in 2025
The country table below is a CPCA passenger-NEV destination view, not a breakdown of CAAM’s 2.615 million total. Belgium’s position partly reflects its role as a European logistics gateway; the destination of record is not always the vehicle’s final retail market. Mexico, Brazil, the Philippines, the UAE and Thailand show that China’s export geography extends far beyond Western Europe.
| Rank | Destination | Reported volume | Reading note |
|---|---|---|---|
| 1 | Belgium | 284,921 | Major European entry and distribution hub. |
| 2 | United Kingdom | 231,181 | Large direct retail market outside the EU tariff regime. |
| 3 | Mexico | 221,027 | Large market; not evidence of onward shipment to the United States. |
| 4 | Brazil | 200,825 | Import growth occurred alongside new local production. |
| 5 | Philippines | 200,544 | One of Southeast Asia’s largest recorded destinations. |
| 6 | United Arab Emirates | 191,900 | Domestic market and regional trading hub. |
| 7 | Thailand | 151,600 | Imports increasingly coexist with local assembly. |
| 8 | Australia | 145,800 | Fast-growing right-hand-drive market. |
| 9 | Indonesia | 126,500 | Imports and investment both shape the market. |
| 10 | India | 102,700 | Reported passenger-NEV destination volume. |
Destination rankings can change rapidly and are sensitive to shipping schedules. They should not be converted into retail market share without local registration data, and they should not be summed into the CAAM total.
Which automakers led the latest passenger-NEV snapshot?
CPCA’s June 2026 passenger-NEV export table puts BYD first, followed by Chery and Geely. Tesla China is fourth, which is a useful reminder that a China-origin export table is not a Chinese-brand ranking. The same month, BYD reported overseas sales above its China-origin passenger-NEV export figure because the company’s overseas measure and production footprint are broader.
| Rank | Manufacturer | Exports | Definition note |
|---|---|---|---|
| 1 | BYD | 170,897 | China-origin passenger NEV exports; not all overseas sales. |
| 2 | Chery | 73,819 | Passenger NEVs only; Chery’s broader exports include combustion vehicles. |
| 3 | Geely | 61,550 | Passenger NEVs from the CPCA manufacturer table. |
| 4 | Tesla China | 36,171 | Made at Shanghai; not a Chinese-owned brand. |
| 5 | SAIC Passenger Vehicle | 30,581 | Passenger-vehicle unit, not every SAIC group export. |
For company context rather than a monthly ranking, see BYDToday’s BYD global expansion guide and the Chery export-strategy owner.
Tariffs and market access in 2026
There is no single “global tariff on Chinese EVs.” Measures differ by vehicle type, origin rule, exporter, price and country. They also change. The owner therefore dates each policy and avoids adding a base tariff to an additional duty unless the customs classification has been checked.
| Market | Current measure | Coverage | Practical meaning |
|---|---|---|---|
| European Union | Definitive countervailing duties of 7.8%–35.3%; price undertakings may be assessed. | Battery-electric vehicles imported from China; rate depends on exporter treatment. | A China-origin rule can cover Chinese and foreign-owned brands; PHEVs are not automatically in the same measure. |
| United States | Section 301 additional duty of 100% on covered China EV tariff lines. | Products of China under specified classifications. | The additional duty effectively blocks normal mass-market imports; confirm the exact HTS line and any other applicable duties. |
| Canada | Annual quota of 49,000 China EVs at the 6.1% MFN rate from March 1, 2026; prior 100% surtax lifted for quota access. | Country-specific EV quota, initially less than 3% of Canada’s new-vehicle market. | Canada’s policy is no longer accurately described as a blanket 100% EV surtax. |
Rules also affect strategy before a car reaches the border. Homologation, cybersecurity, connected-vehicle rules, battery passports, local content, dealer and repair networks, finance, insurance and residual values can be as important as the headline tariff.
From exporting cars to producing them locally
Export growth is only the first stage of internationalization. Local assembly can reduce logistics time, qualify for incentives, adapt products to local requirements and manage tariff exposure. It also makes the data harder to read: a locally built vehicle can count as an overseas sale for the automaker but not as a vehicle export from China.

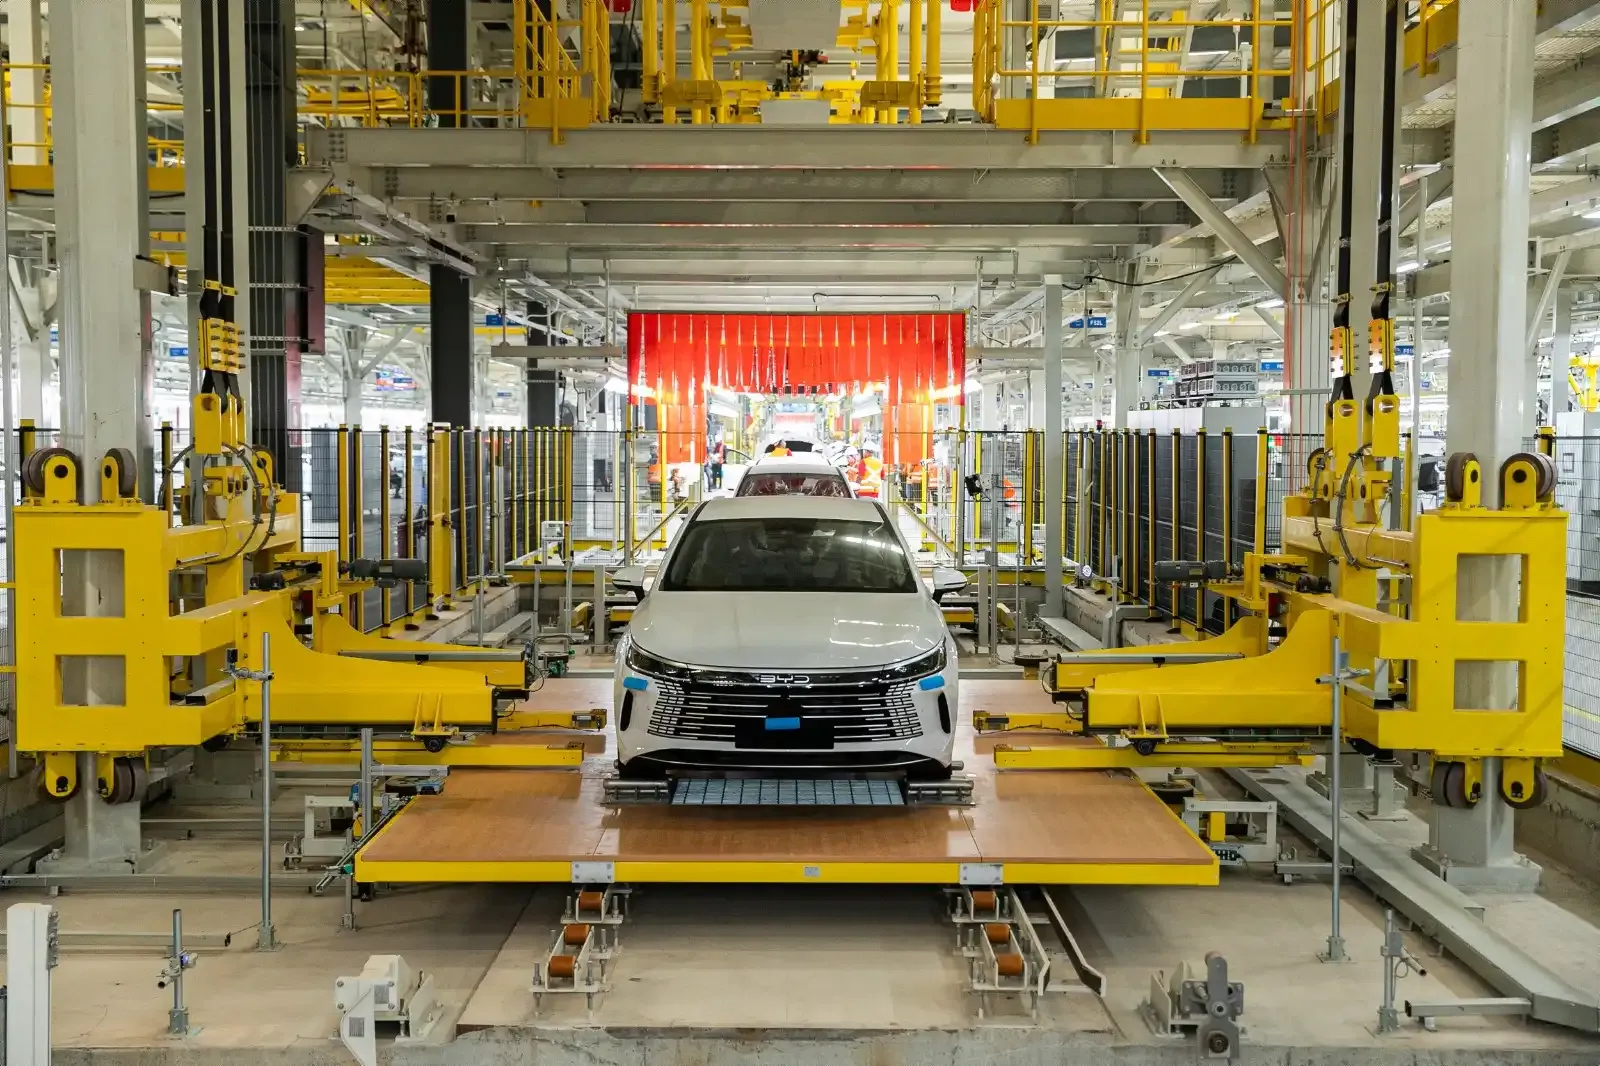
Three conclusions follow:
- Exports can slow while overseas sales rise if local factories replace imported units.
- A brand ranking is not a country-of-origin ranking once production spreads across Thailand, Brazil, Europe and other markets.
- Localization quality matters: sourcing, workforce, supplier development, aftersales capacity and product adaptation determine whether a factory creates durable market access.
How to use this tracker
- For a national trend, quote the CAAM row and include the period.
- For trade volume or value, use customs data and include the commodity definition.
- For destinations or manufacturer shares, label the CPCA passenger-car scope.
- For a company, distinguish China-origin exports, overseas sales and locally built vehicles.
- For tariff comparisons, state the date, vehicle type and whether the rate is additional or total.
- Never annualize a partial-year result without marking it as a scenario rather than an official forecast.
Continue researching: BYDToday’s China NEV Knowledge Hub connects this tracker with company histories, battery, charging, technology and global-market owners.
Frequently Asked Questions
How many NEVs did China export in 2025?
CAAM reported 2.615 million NEV exports in full-year 2025: 1.646 million battery-electric vehicles and 969,000 plug-in hybrids. Customs- or CPCA-derived totals can be higher because their scope and recording method differ.
How many NEVs did China export in 2026?
CAAM reported 2.355 million NEV exports from January through June 2026, including 523,000 in June alone. This is a first-half result, not a full-year total or an annualized forecast.
Why do CAAM and customs export totals differ?
CAAM collects manufacturer-reported export shipments, while customs records border declarations under commodity codes. Timing, chassis and CKD coverage, vehicle scope, revisions and classification can all create legitimate differences.
Do China EV export totals include Tesla?
Origin-based and manufacturer export data can include Tesla vehicles built at Giga Shanghai. That makes Tesla China part of China-origin export tables, but it does not make Tesla a Chinese-owned brand.
Which countries import the most China-made NEVs?
In CPCA’s 2025 passenger-NEV destination table, Belgium ranked first, followed by the United Kingdom, Mexico, Brazil and the Philippines. Belgium is also a logistics gateway, so destination data is not identical to final registrations.
Is overseas sales the same as exports?
No. A company’s overseas sales can include vehicles produced locally outside China and may use wholesale, retail or delivery definitions. China exports measure vehicles shipped from China under the stated industry or customs system.
Primary and current sources
- Ministry of Commerce enterprise service, 2021 and 2022 CAAM/customs history
- National Development and Reform Commission, 2022 vehicle and NEV exports
- National Development and Reform Commission, 2023 NEV export result and globalization analysis
- Ministry of Industry and Information Technology, 2024 CAAM vehicle and NEV exports
- State Council Information Office, 2025 CAAM vehicle and NEV exports
- National Bureau of Statistics statistical communiqué, 2025 customs automobiles including chassis
- People’s Daily, June and H1 2026 CAAM release
- China Radio International, H1 2026 total, BEV and PHEV export breakdown
- CnEVPost, January 2026 CAAM exports, March and Q1 CAAM exports and May 2026 CAAM exports
- CnEVPost, June 2026 CPCA passenger-NEV exporter table
- Shanghai Going Global service platform, 2025 CPCA destination data
- European Commission, China-origin BEV countervailing duties and undertaking guidance
- Office of the U.S. Trade Representative, Section 301 EV tariff rate
- Government of Canada, March 2026 China EV quota and 6.1% MFN rate
- BYD, Thailand plant capacity and production processes